DEX-to-CEX Spot Volume Ratio reached a record 24.16% in July, marking the highest level recorded since the dataset began in January 2019.
The reading extended a shift toward onchain trading, with the ratio staying above 10% every month since April 2025.
Source: The Block
The result appeared to show strong growth for decentralized exchanges. However, the underlying figures showed that trading activity declined across both decentralized and centralized venues. The record was driven by a sharper contraction in centralized exchange volume rather than expanding DEX turnover.
DEX Volumes Decline as CEX Activity Falls Faster
Spot DEX trading volume dropped 6% from June to $124.82 billion in July. That total represented the weakest month for onchain spot activity since September 2024.
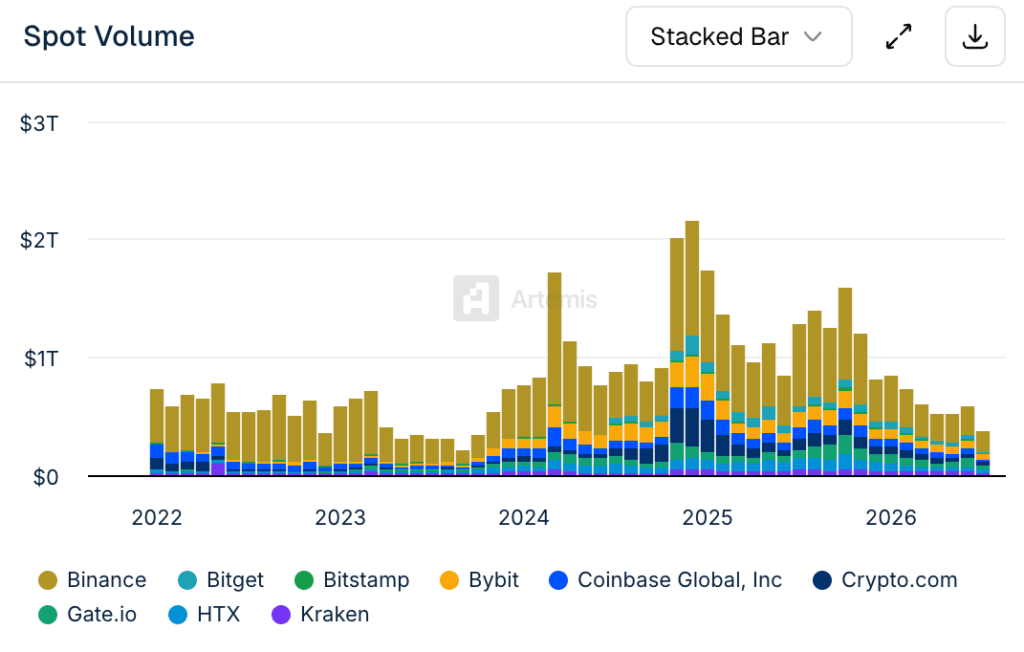
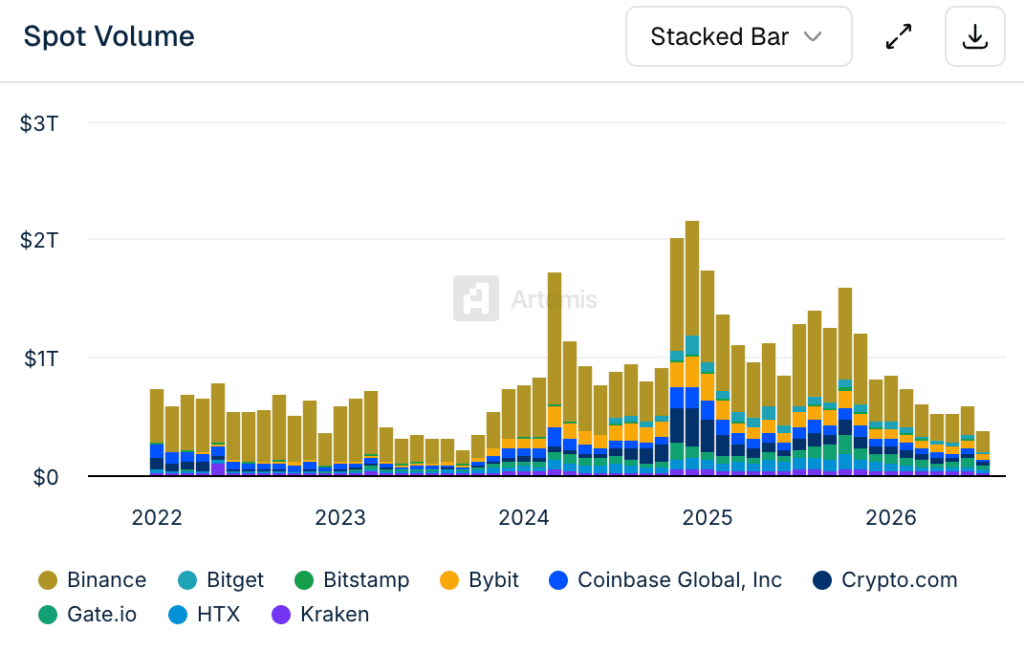
Centralized exchanges recorded a steeper decline. Artemis data showed that Tier-1 CEX spot volume totaled $375 billion during July, its lowest monthly figure since October 2023.
Source: Artemis
The record ratio therefore reflected a shrinking market in which decentralized platforms retained a larger portion relative to centralized venues. Traders reduced activity across the market, but centralized exchanges experienced the heavier decline.
Seasonal trading slowdowns are common during the summer. July’s figures showed that decentralized venues held up better during the latest reduction in spot activity, even though their own monthly turnover also weakened.
Record Ratio Does Not Represent Market Share
The 24.16% reading compares monthly decentralized exchange volume with volume from a filtered group of major centralized exchanges. The Block removes flash trades and includes only centralized venues considered reliable for reporting purposes.
Exchanges outside that selected group are excluded from the denominator. As a result, the figure does not mean that decentralized exchanges processed nearly one-quarter of all global crypto spot trading in July.
Instead, onchain spot volume equaled roughly 24% of the volume handled by the vetted centralized exchanges included in the calculation. The ratio remains useful for measuring changes between months, but it should not be presented as total market share.
Onchain Execution Narrows Earlier Trading Gaps
The longer-term rise in the ratio reflects improvements that began before July. DEX aggregators can now match or outperform centralized exchange pricing on some spot trades worth several million dollars. Two years earlier, slippage often encouraged larger transactions to remain on centralized order books.
Decentralized venues provide faster access to newly launched assets. Tokens can begin trading onchain from their first block, while centralized listings may arrive weeks later or never occur.
Robinhood Chain added activity in July by supporting trading flows without an immediate centralized alternative. These developments have helped establish a higher base for the ratio.
The next comparison will come during a month with stronger retail participation and liquidity. July’s record shows decentralized platforms preserved relatively more activity during a marketwide slowdown.